Using the Ecosystem Graph
The Ecosystem Graph shows how AdTech companies connect: who owns whom, who integrates with whom, who competes, and who works where. This guide walks through each thing you can do on it, task by task.
What you're looking at
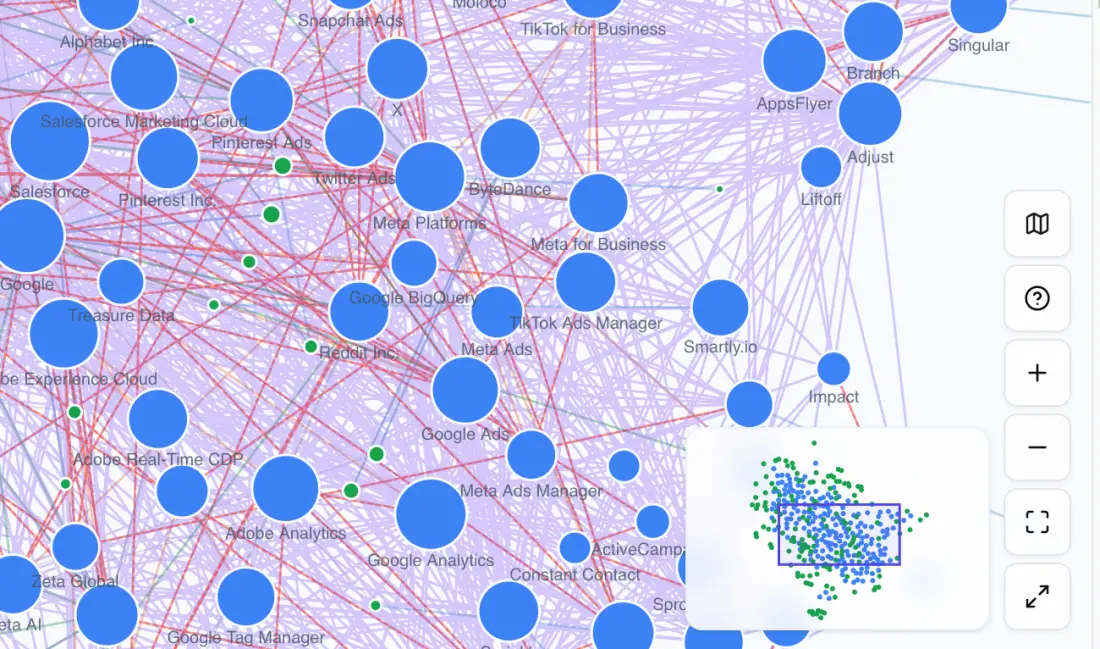
- Dots are companies (bigger means a higher tier), plus people and events. Hover any dot to see its type, tier and how it is connected.
- Lines are relationships. Their color tells you the kind: Structural (ownership, mergers), Operational (integrations, partnerships, competition), Roles (people and their companies) and Discovery. Open Legend (top right) for the key.
- By default the graph shows the 200 most-connected companies and the people and events around them. The badge at the bottom left counts what is drawn; What's not shown? explains what was left out and how to add it.
- Explore, Landscape and Focus (top left) switch between the free-form network, companies grouped by category, and one company's neighborhood.
Find a company
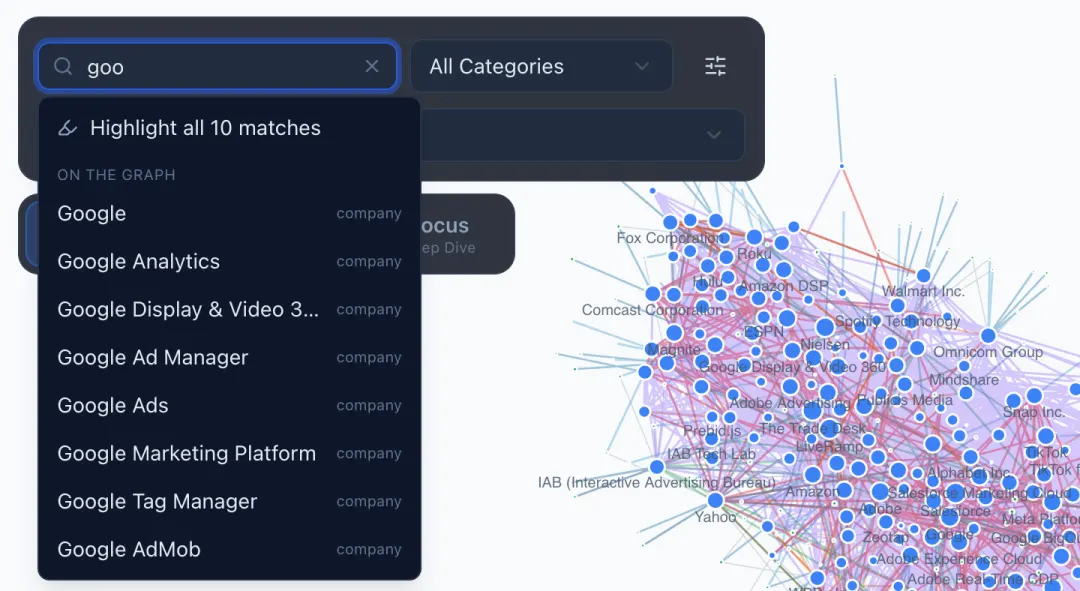
- Click Find a company or person… (or press
/) and start typing. - Results are split into On the graph and Not shown. Press
Enterto jump to the first match: the graph frames it and opens its panel. - To light up every match instead, choose Highlight all N matches.
A company that isn't on the graph opens in Focus (just it and its connections); Back returns you to where you were.
See a company's connections
- Click a company to open its panel: summary, relationships grouped by kind, recent news, and View Full Profile.
- Hover a company to light its direct connections and dim the rest.
- Hover or click a line to see how two companies are connected, since when, and whether it is independently verified.
- Focus (in the panel, or the mode switch) redraws the graph around one company and its neighborhood.
Compare companies with pins
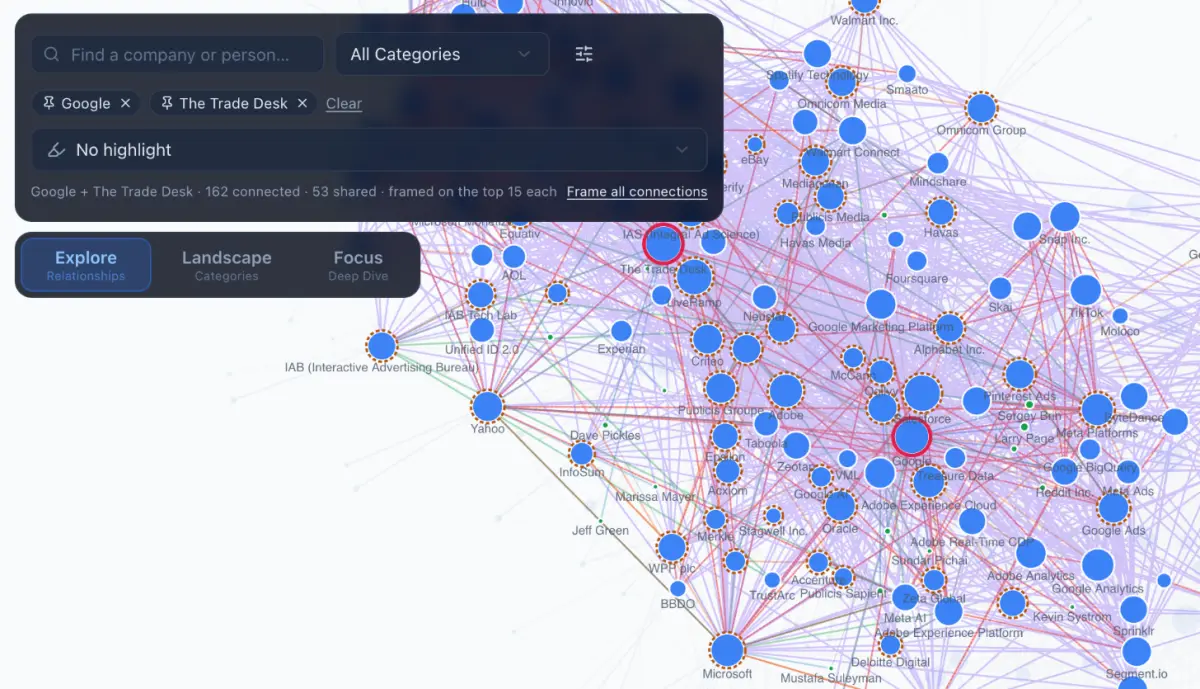
Pin a company to keep its connections lit while you click around: choose Pin in its panel, press S, or
Shift-click it. Pin up to five. Connections that pinned companies share get a dashed ring, so overlaps stand
out. By default each pin frames its top 15 connections; Frame all connections shows every one. Clear unpins
them all.
Trace a path between two companies
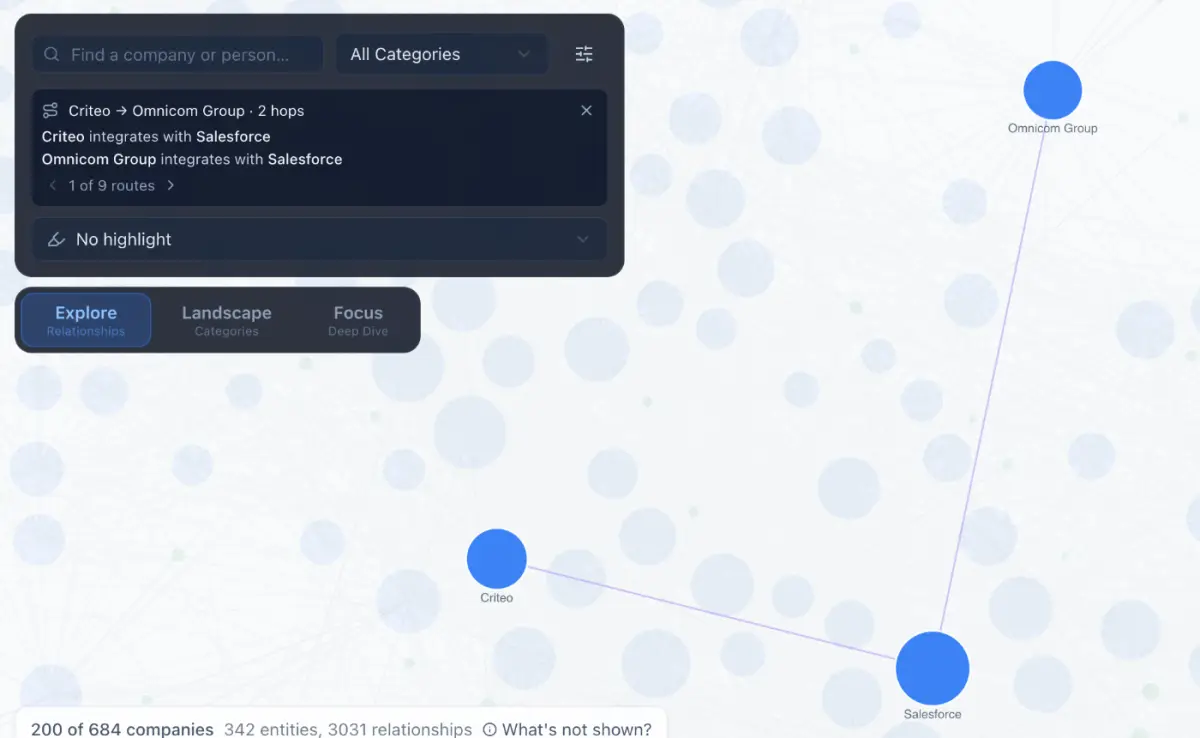
- Open a company's panel and choose Path to… (or press
P). - Pick the other company in Find.
- The shortest chain lights up, with every hop explained. When there are several equally short routes, step through them with the arrows. If the two aren't linked on the graph, ATDb searches beyond it and lists the hops.
Highlight and color
- Highlight… (under Find) lights a ready-made group: Walled gardens, Publishers, DSPs, SSPs & Exchanges, Connected TV, Retail media, Holdcos, the Top 10 or Top 25 most connected, or the S and A tiers.
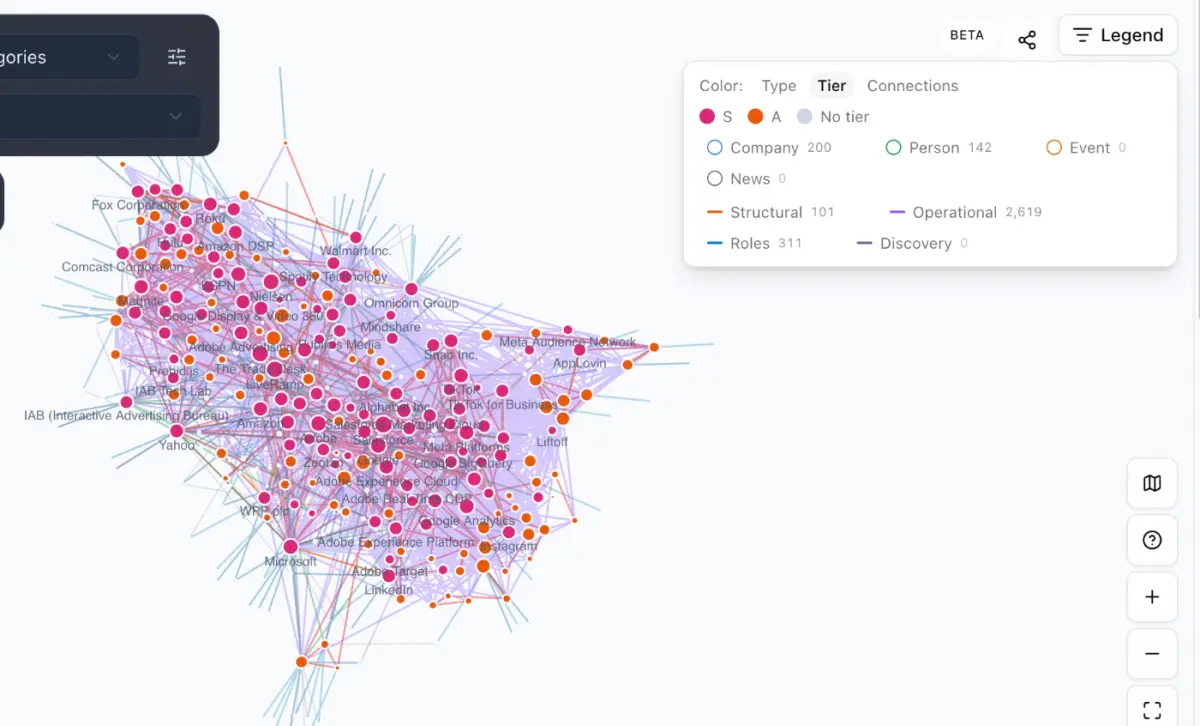
- In the Legend, Color switches dot colors between Type, Tier and Connections. Tier makes the S and A leaders stand out; Connections shades from least to most connected.
- Also in the Legend: click a type (Company, Person, Event, News) or a line kind to hide or show it. Each entry shows how many are on the graph.
Change what's on the graph
Open the filters (the sliders button next to the category menu) to:
- choose Companies shown: Top 200, Top 400 or All, most-connected first;
- pick Tiers (S Core, A Ecosystem, B Infrastructure, C MarTech, D Adjacent);
- Show former companies (acquired or shut down; drawn faded) and Show products & divisions.
The category menu narrows the graph to one category. What's not shown? at the bottom left always tells you what the current view leaves out.
Move around
- Scroll to zoom, drag the background to pan, drag a dot to pull it out of a cluster.
Ffits everything on screen,Ccenters on the open company,+and−zoom.- Overview map (
M, or the map button): when you zoom in, a small map in the bottom-right corner shows where you are. Click it to jump there, or drag its box to move around. - Full screen (
Shift+F, or the button at the bottom of the zoom controls): the graph fills your whole screen. PressEscor the button again to return.
Share a view
Everything you set (filters, highlights, pins, paths, colors, the open company) is part of the page address. The share button (top right) copies a link that reopens exactly this view.
On a phone
On a phone the graph becomes a list you can search and filter. Find, Highlight and Focus work the same way; tap a company to open its details.
Keyboard shortcuts
| Key | Does |
|---|---|
/ | Find a company |
Enter | Jump to the first match |
S | Pin or unpin the open company |
P | Path from the open company to another |
F | Fit everything on screen |
C | Center on the open company |
+ / − | Zoom in / out |
M | Show or hide the overview map |
Shift+F | Full screen |
Esc | Step back (close Find, the panel, or full screen) |